
2025 North American Midstream Infrastructure Report
Global energy demand is rising rapidly, and natural gas is poised to help meet that demand. North America is becoming a significant supplier of that global need as well as satisfying increasing domestic demand. However, continuing to do so will require the rapid buildout of pipelines and related infrastructure to transport molecules from production basins to end users.
Findings Overview
The INGAA Foundation report finds that natural gas from North America will see sustained-long term demand and will require more than $1 trillion in capital investment to build at least 37,000 miles of additional transmission pipeline capacity and 103,000 miles of gathering pipelines through 2052. Of that total, 33,800 miles of new transmission pipeline will be located within the United States (U.S.). An additional 12.4 million horsepower for compression associated with natural gas transmission will be necessary over that time in the U.S. and Canada. The report also estimates that 12–24 million cumulative jobs will be required in North America over 25 years.
The report reflects current and anticipated market conditions for North American midstream infrastructure, and assesses the scale, location, and timing of needed infrastructure expansion required through 2052.
The study models outcomes under two primary scenarios:
- A business as usual reference case that is based on the existing energy policy environment. It takes into account federal, state, provincial, and local policies and regulations in effect in the U.S. and Canada as of April 1, 2025.
- A low carbon scenario that accounts for state and provincial GHG reduction targets across the U.S. and Canada, which influence projected energy demand, fuel selection, and infrastructure development.
Across both scenarios, the reports finds that natural gas remains the backbone of the North American energy system. Even as renewable generation, nuclear power, and energy efficiency expand, demand for energy grows sufficiently to require higher absolute volumes of natural gas. Two market forces dominate long-term outlook: rapidly rising demand for electricity, particularly from data centers and other digital infrastructure, and sustained growth in LNG exports serving global markets.
Key Findings of the Report
- Total new midstream investment across natural gas, oil, natural gas liquids, hydrogen, and CO₂ infrastructure is projected to range from roughly $1.2 trillion to $1.4 trillion (in 2022 dollars) over the modeling period, averaging $40–$48 billion annually.
- An estimated 12–24 million cumulative jobs will be required over 25 years (including 2–4 million direct, 4–8 million indirect, and 6–12 million induced jobs), or roughly 414,000–828,000 jobs annually throughout the study period, varying with investment.
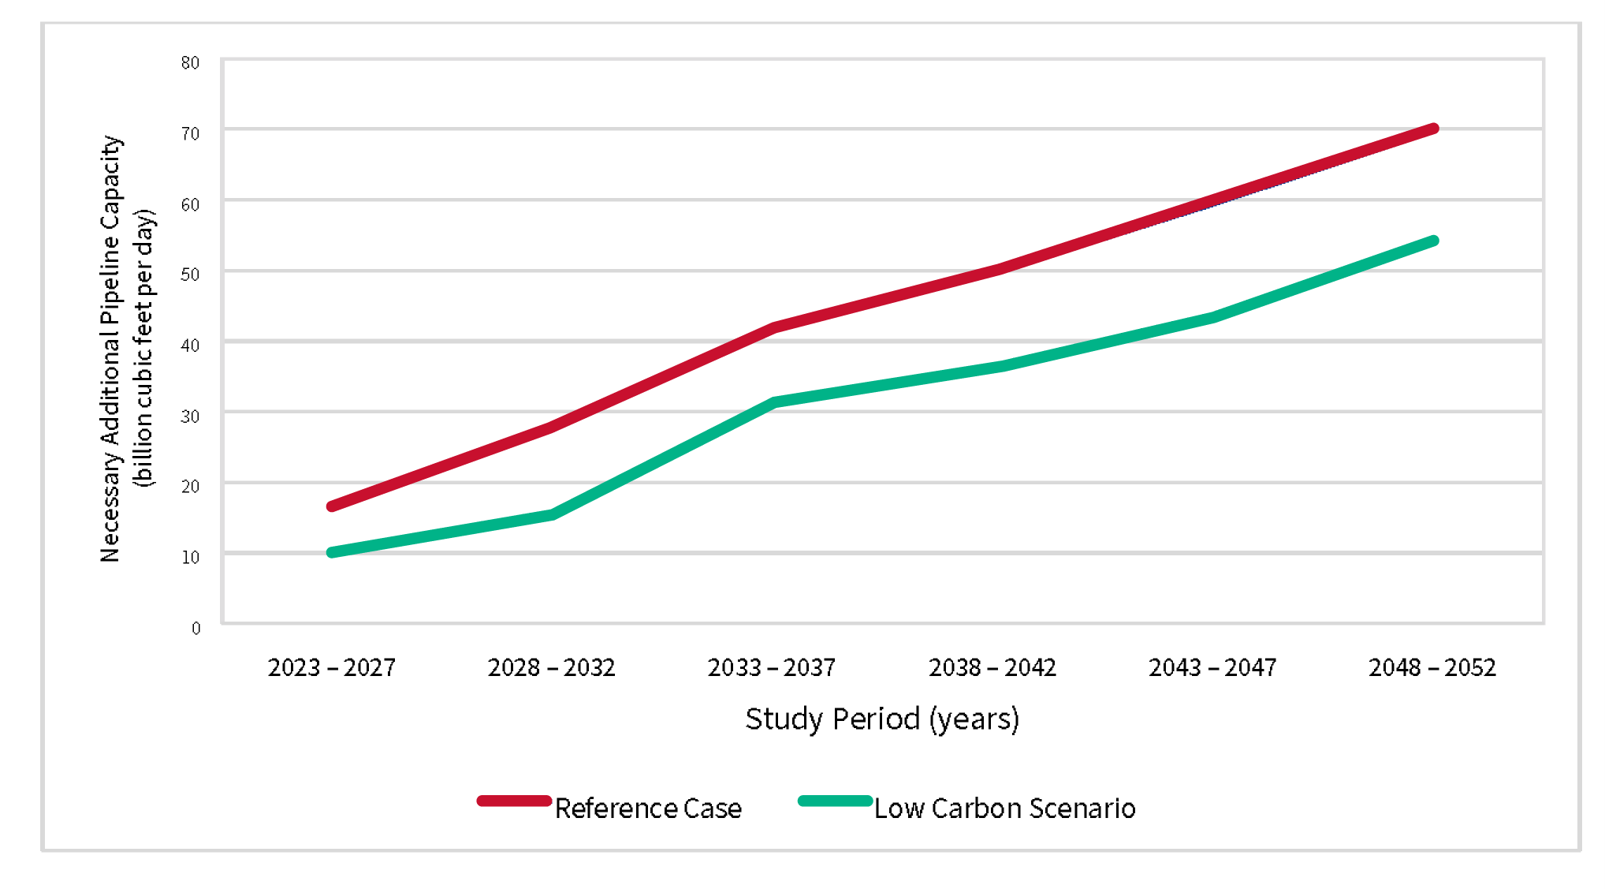
- At the most conservative estimate, 70 billion cubic feet per day (Bcf/d) of additional natural gas transmission capacity will be needed, representing a 39% increase over 2022 levels (Fig. 1), all of which is expected to be incremental to existing infrastructure.
- At least 37,000 miles of additional natural gas transmission pipelines (33,800 of which will be in the U.S.) and 103,000 miles of gathering pipelines will be required by 2052.
- Modeling results are intentionally reported on annual average daily gas flows, not peak gas flows, but developers must design and build facilities to meet the peak or highest level of contracted demand, which can be approximated with an average-to-peak load factor of 1.8x.
- An additional 8.6 to 12.4 million horsepower for compression associated with natural gas transmission will be necessary over the study period, reflecting higher pipeline throughput and network expansion.
- Electricity generation from all energy sources is projected to reach 5,858 terawatt hours (TWh) in 2052, up from 4,063 TWh in 2022, an increase of 27%.
- Natural gas will fuel 33% of electricity generation in the reference case and 27.5% in the low carbon scenario.
- Data centers are a major contributor to rising electricity demand. The U.S. Department of Energy (DOE) estimates data center consumption could reach 800 TWh annually by 2050, up from 300 TWh in 2025.
- LNG exports represent the single largest source of incremental natural gas demand over the study horizon. Under both scenarios, U.S. LNG exports more than triple by 2052.
- U.S. annual natural gas production increases from 36.43 trillion cubic feet (Tcf) in 2022 to 48.64 Tcf in 2052 in the reference case. Growth is concentrated in Texas; the Northeast; the South-Central region, including Louisiana, Arkansas, and Oklahoma; and Central and Mountain West.
- Emerging fuels and decarbonization strategies such as hydrogen and carbon capture, utilization and storage (CCUS) contribute incrementally to infrastructure needs, particularly under the low carbon scenario.
Natural gas will remain a cornerstone of the North American energy system through 2052 under both scenarios even as renewables and other low carbon energy sources continue to expand. Timely investment, predictable permitting processes, and long-term planning will be essential to ensuring that North American energy infrastructure can reliably support economic growth, energy security, and evolving policy objectives through 2052.
The INGAA Foundation’s 2025 North American Midstream Infrastructure Report examines the future need for and cost of developing midstream infrastructure in North America required to meet projected energy demand through 2052.
In the report, midstream infrastructure refers to the network of physical assets and associated systems that connect energy production to end-use markets by enabling the gathering, transportation, processing, and conditioning of energy commodities. Within this context, midstream infrastructure includes:
- Pipeline systems for natural gas, natural gas liquids (NGLs), crude oil, refined products, hydrogen, and CO₂, including both transmission and, where applicable, gathering lines
- Compression and pumping stations necessary to maintain flow, pressure, and system integrity
- Processing and treatment facilities, including natural gas processing plants, NGL fractionation facilities, and hydrogen conditioning or handling equipment.
Collectively, these assets form the logistical backbone of the North American energy system.
Study Regions
The report details the current and anticipated outlook and market conditions for United States and Canadian midstream infrastructure, with data reported in total and based on national boundaries. It is aggregated by state and province to the extent that detailed information and forecasts are available. For the U.S., the study modeled 12 regions, with Texas, California, and New York modeled as standalone regions. In Canada, the study was modeled at the provincial level but reported in aggregate.
Methodology
The analysis was conducted by a consortium of independent technical and market experts assembled by The INGAA Foundation. The University of Houston provided academic leadership and economic analysis, Wood contributed global engineering, cost, and project development expertise, and ESMIA supplied NATEM, an economy-wide techno-economic optimization model used to assess long-term energy system evolution.
NATEM runs from 2023 to 2052 in 5-year increments, with 2022 and earlier used for calibration. The first modeled period is 2025, representing 2023 to 2027. Additionally, 16 sub-annual time periods are used to capture seasonal production fluctuations to account for electricity production and hydrogen electrolysis.
Scenarios
Two scenarios were developed to frame the analysis of future North American midstream infrastructure needs. Together, these scenarios provide insight into how differing regulatory environments could affect natural gas demand, infrastructure utilization, and investment requirements over the study period.
Reference Scenario
The reference scenario serves as the baseline for this analysis and represents a business-as-usual outlook based on the existing energy policy environment. It reflects federal, state, provincial, and local policies and regulations in effect in the United States and Canada as of April 1, 2025.
The reference scenario assumes continued application of current regulatory frameworks governing energy production, transportation, and consumption, as well as prevailing technology performance and cost trends. Exceptions to the April 1, 2025, policy cutoff are the inclusion of provisions contained in the One Big Beautiful Bill Act (Public Law No. 119-21), which was enacted in mid-2025 and is treated as a committed policy, and the U.S. Energy Information Administration (EIA) Short-Term Energy Outlook from June 2025.
Within the modeling framework, the reference scenario establishes baseline energy service demands and determines the resulting natural gas, oil, and NGL flows required to meet those demands.
Midstream infrastructure requirements are derived endogenously based on the least cost combination of existing assets, expansions, and new facilities needed to satisfy projected supply and demand under current policy conditions.
Low Carbon Scenario
The low carbon scenario explores the implications of more aggressive greenhouse gas (GHG) reduction efforts in North America and globally. In the United States, this scenario incorporates binding GHG reduction targets established by individual states that have adopted economy-wide or sector-specific emissions goals. In Canada, provincial GHG reduction targets are applied. These constraints are implemented directly in the model by limiting emissions in the relevant jurisdictions, thereby influencing fuel choice, energy consumption patterns, and infrastructure utilization.
Unlike the reference scenario, the low carbon scenario does not assume a uniform national climate policy in the United States. Instead, it reflects a patchwork of state- and province-level climate actions that were in place or formally adopted as of the modeling start date. This distinction is made explicitly to avoid conflating existing subnational policies with hypothetical future federal mandates.
In addition to domestic policy differences, the low carbon scenario assumes stronger global climate action relative to the reference scenario. While specific international policies such as carbon border adjustment mechanisms, explicit carbon pricing, or tighter global emissions standards are not modeled individually, their combined effect is represented through alternative assumptions for international energy markets. These assumptions influence global natural gas demand, particularly for liquefied natural gas (LNG), and therefore affect North American production, pipeline flows, and export infrastructure requirements.
As in the reference scenario, technology costs and performance are modeled in the low carbon scenario using central cost assumptions. Differences in outcomes between the two scenarios are driven primarily by policy-induced changes in emissions constraints, fuel demand, and market conditions rather than by assumptions about technological breakthroughs.
Sensitivity Analysis
LNG exports and data center electricity demand emerged as two of the most significant drivers of future natural gas demand and infrastructure needs in both the reference case and low carbon scenario. These drivers were selected because of their scale, growth potential, and uncertainty within the modeling framework, rather than as forecasts of specific outcomes. To test the robustness of the report’s findings, the study evaluated + or - 30% sensitivity cases after determining that smaller variations did not materially change the results. Even under these assumptions, the need for significant infrastructure expansion remained consistent, with natural gas transmission requirements increasing from 70 Bcf/d to as much as 84 Bcf/d.
Results
The results indicate that natural gas remains a core component of the North American energy system through 2052 under both the reference and low carbon scenarios, supporting domestic consumption, electricity generation, and export demand. While growth moderates under emissions constraints, overall production and infrastructure requirements remain substantial.
- Natural gas production increases under both scenarios, driven by domestic demand for electricity generation and exports. In the reference scenario, dry gas production rises in the United States from 36.43 Tcf/yr in 2022 to 48.64 Tcf/yr in 2050; in Canada it rises from 5.76 Tcf/yr in 2022 to 6.93 Tcf/yr in 2050 (Tables 1 and 2).
| 2022 | 2025 | 2030 | 2035 | 2040 | 2045 | 2050 | |
|---|---|---|---|---|---|---|---|
| Reference Case | 36.43 | 40.24 | 41.56 | 44.22 | 45.12 | 47.17 | 48.64 |
| Low Carbon Scenario | 36.43 | 39.44 | 39.81 | 43.24 | 42.85 | 42.73 | 43.51 |
| 2022 | 2025 | 2030 | 2035 | 2040 | 2045 | 2050 | |
|---|---|---|---|---|---|---|---|
| Reference Case | 5.76 | 5.97 | 6.40 | 6.52 | 6.83 | 6.81 | 6.93 |
| Low Carbon Scenario | 5.76 | 5.71 | 5.58 | 5.87 | 6.44 | 6.42 | 6.49 |
- LNG exports represent the single largest source of incremental natural gas demand over the study horizon, rising by approximately 3.3 times from 2022 levels to reach 40.52 Bcf/d by 2052.
- Electricity demand growth sustains natural gas consumption, even as its share of total generation declines. Gas-fired generation increases in absolute terms to meet higher electricity demand in both scenarios, reaching 1,962 TWh in the reference case and 1,733 TWh in the low carbon case by 2052.
- Under the reference scenario, more than 33,800 miles of new transmission pipelines are needed in the United States by mid-century, increasing to just over 37,000 miles when Canada is included. The low carbon scenario still requires total expansion to approximately 25,500 miles across the United States and Canada.
- The study’s pipeline mileage and investment estimates are based on annual average daily natural gas flows. In practice, however, pipeline systems are designed to meet peak demand conditions while preserving capacity for maintenance and operational flexibility. Winter Storm Enzo in January 2024 illustrated this distinction, with actual throughput reaching approximately 1.8 times average demand. This average-to-peak relationship suggests actual infrastructure build requirements could exceed the study’s average-flow estimates..
- Infrastructure growth is concentrated in later years and in key regions. Texas accounts for the largest regional expansion, reflecting its role as a major production center, LNG export hub, and industrial demand region.
- Gathering pipeline expansion is driven by production intensity and export infrastructure. Texas shows the highest gathering pipeline requirements due to its extensive production footprint, continued drilling activity, and proximity to Gulf Coast LNG export terminals, which are projected to handle 45–50 Bcf/d by 2052.
- In the reference case, 70 Bcf/d of additional pipeline capacity is needed between 2023 and 2052. Sensitivity analysis found that increasing LNG export demand by 30% raises pipeline requirements to 83 Bcf/d, while a 30% decrease reduces them to 68 Bcf/d. Similarly, sensitivity analysis of data center electricity demand found that higher demand scenarios have a disproportionate impact on pipeline capacity requirements, increasing cumulative additions to 84 Bcf/d, while lower-demand scenarios remain largely consistent with the reference case.
Emerging Fuels and CCUS Findings
Emerging fuels and carbon management technologies could meaningfully expand midstream infrastructure requirements over the study period, though outcomes vary widely across scenarios and are strongly influenced by policy and market conditions.
- Hydrogen production increases under both scenarios, with substantially higher growth in the low carbon case. U.S. hydrogen production reaches approximately 1.8 million terajoules by 2052 in the reference scenario and more than doubles to 4.2 million terajoules in the low carbon scenario.
- Expanded hydrogen production drives new pipeline infrastructure needs. Additional dedicated pipeline capacity totals approximately 25,000 tons per day by 2052 in the reference scenario and more than 77,000 tons per day in the low carbon scenario.
- Carbon capture, utilization and storage (CCUS) significantly increases CO₂ pipeline requirements, particularly under more stringent emissions constraints. In the reference scenario, additional CO₂ pipeline capacity reaches approximately 101,600 tons per day by 2052 (24,486 tons per day in 2023–2027), while the low carbon scenario requires substantially a greater buildout of 1.5 million tons per day (96,396 tons per day in 2023–2027).
Significant Conclusions
- Across both the reference case, and importantly, the low carbon scenario and each of the sensitivity cases natural gas remains the cornerstone of the North American energy system through 2052.
- Growth in LNG exports and rising electricity demand are the dominant drivers of increased natural gas production and infrastructure requirements in the region.
- Regardless of the policies and the scenarios modeled, there is a significant need to build out infrastructure. At the very minimum midstream investment of approximately $1.2–$1.4 trillion will be required to support projected demand, which could lead to the growth of 12–24 million jobs in North America over the study period.
- Timely investment, predictable permitting processes, and long-term planning will be essential to ensure that infrastructure expansion keeps pace with demand growth in the region.
Appendix
Research Team and Data Sources
The research team consisted of senior leaders from the University of Houston (UH), Wood, and Energy Super Modelers and International Analysts (ESMIA), with supplemental industry context provided by subject matter experts.
ESMIA supplied the North American TIMES Energy Model (NATEM), which was used to model components of the North American energy system to 2052 with an emphasis on midstream infrastructure of the natural gas sector.
The University of Houston researchers used historic and current data to support the technoeconomic modeling associated with this report. The data was principally gathered from publicly available sources, including:
- The United States Energy Information Agency (EIA)
- The International Energy Agency (IEA)
- electric Power Research Institute (EPRI)
- Oil & Gas Journal
- Federal Energy Regulatory Commission (FERC)
- Canadian Energy Regulator (CER)
This data was supplemented to reflect changes made by the enacted H.R. 1, the One Big Beautiful Bill Act of 2025 (budget reconciliation package) and updated to include the analysis contained in the U.S. Energy Information Administration (EIA) Short-Term Energy Outlook from June 2025. Other policy and regulatory factors were considered as they existed on April 1, 2025.