Energy Affordability in the United States
Why Your Electricity Bill is Rising
Americans track gas prices at the pump, in the news, and in financial markets. Electricity prices, however, show up in monthly bills and have become an unpleasant expense for many.
The average household in the United States now pays $178 per month for electricity, with some of the highest bills in states like Texas, Louisiana, and Florida. Unexpectedly, this is not a story about fuel prices or the energy market, but about infrastructure, policy, and who carries the cost burden. Our research on energy affordability and grid resilience shows that the biggest contributor to rising electricity bills is not the gas burned to produce power, but rather the cost of pipes, wires, and poles that deliver it, as well as regulatory charges.
Transmission and distribution (T&D) costs, which cover the construction and maintenance of the physical grid infrastructure, now account for between a third and almost half of the average residential electricity bill in major Gulf Coast cities. When regulatory charges and storm-hardening investments are included, non-generation costs can make up as much as 80% of a household's bill.
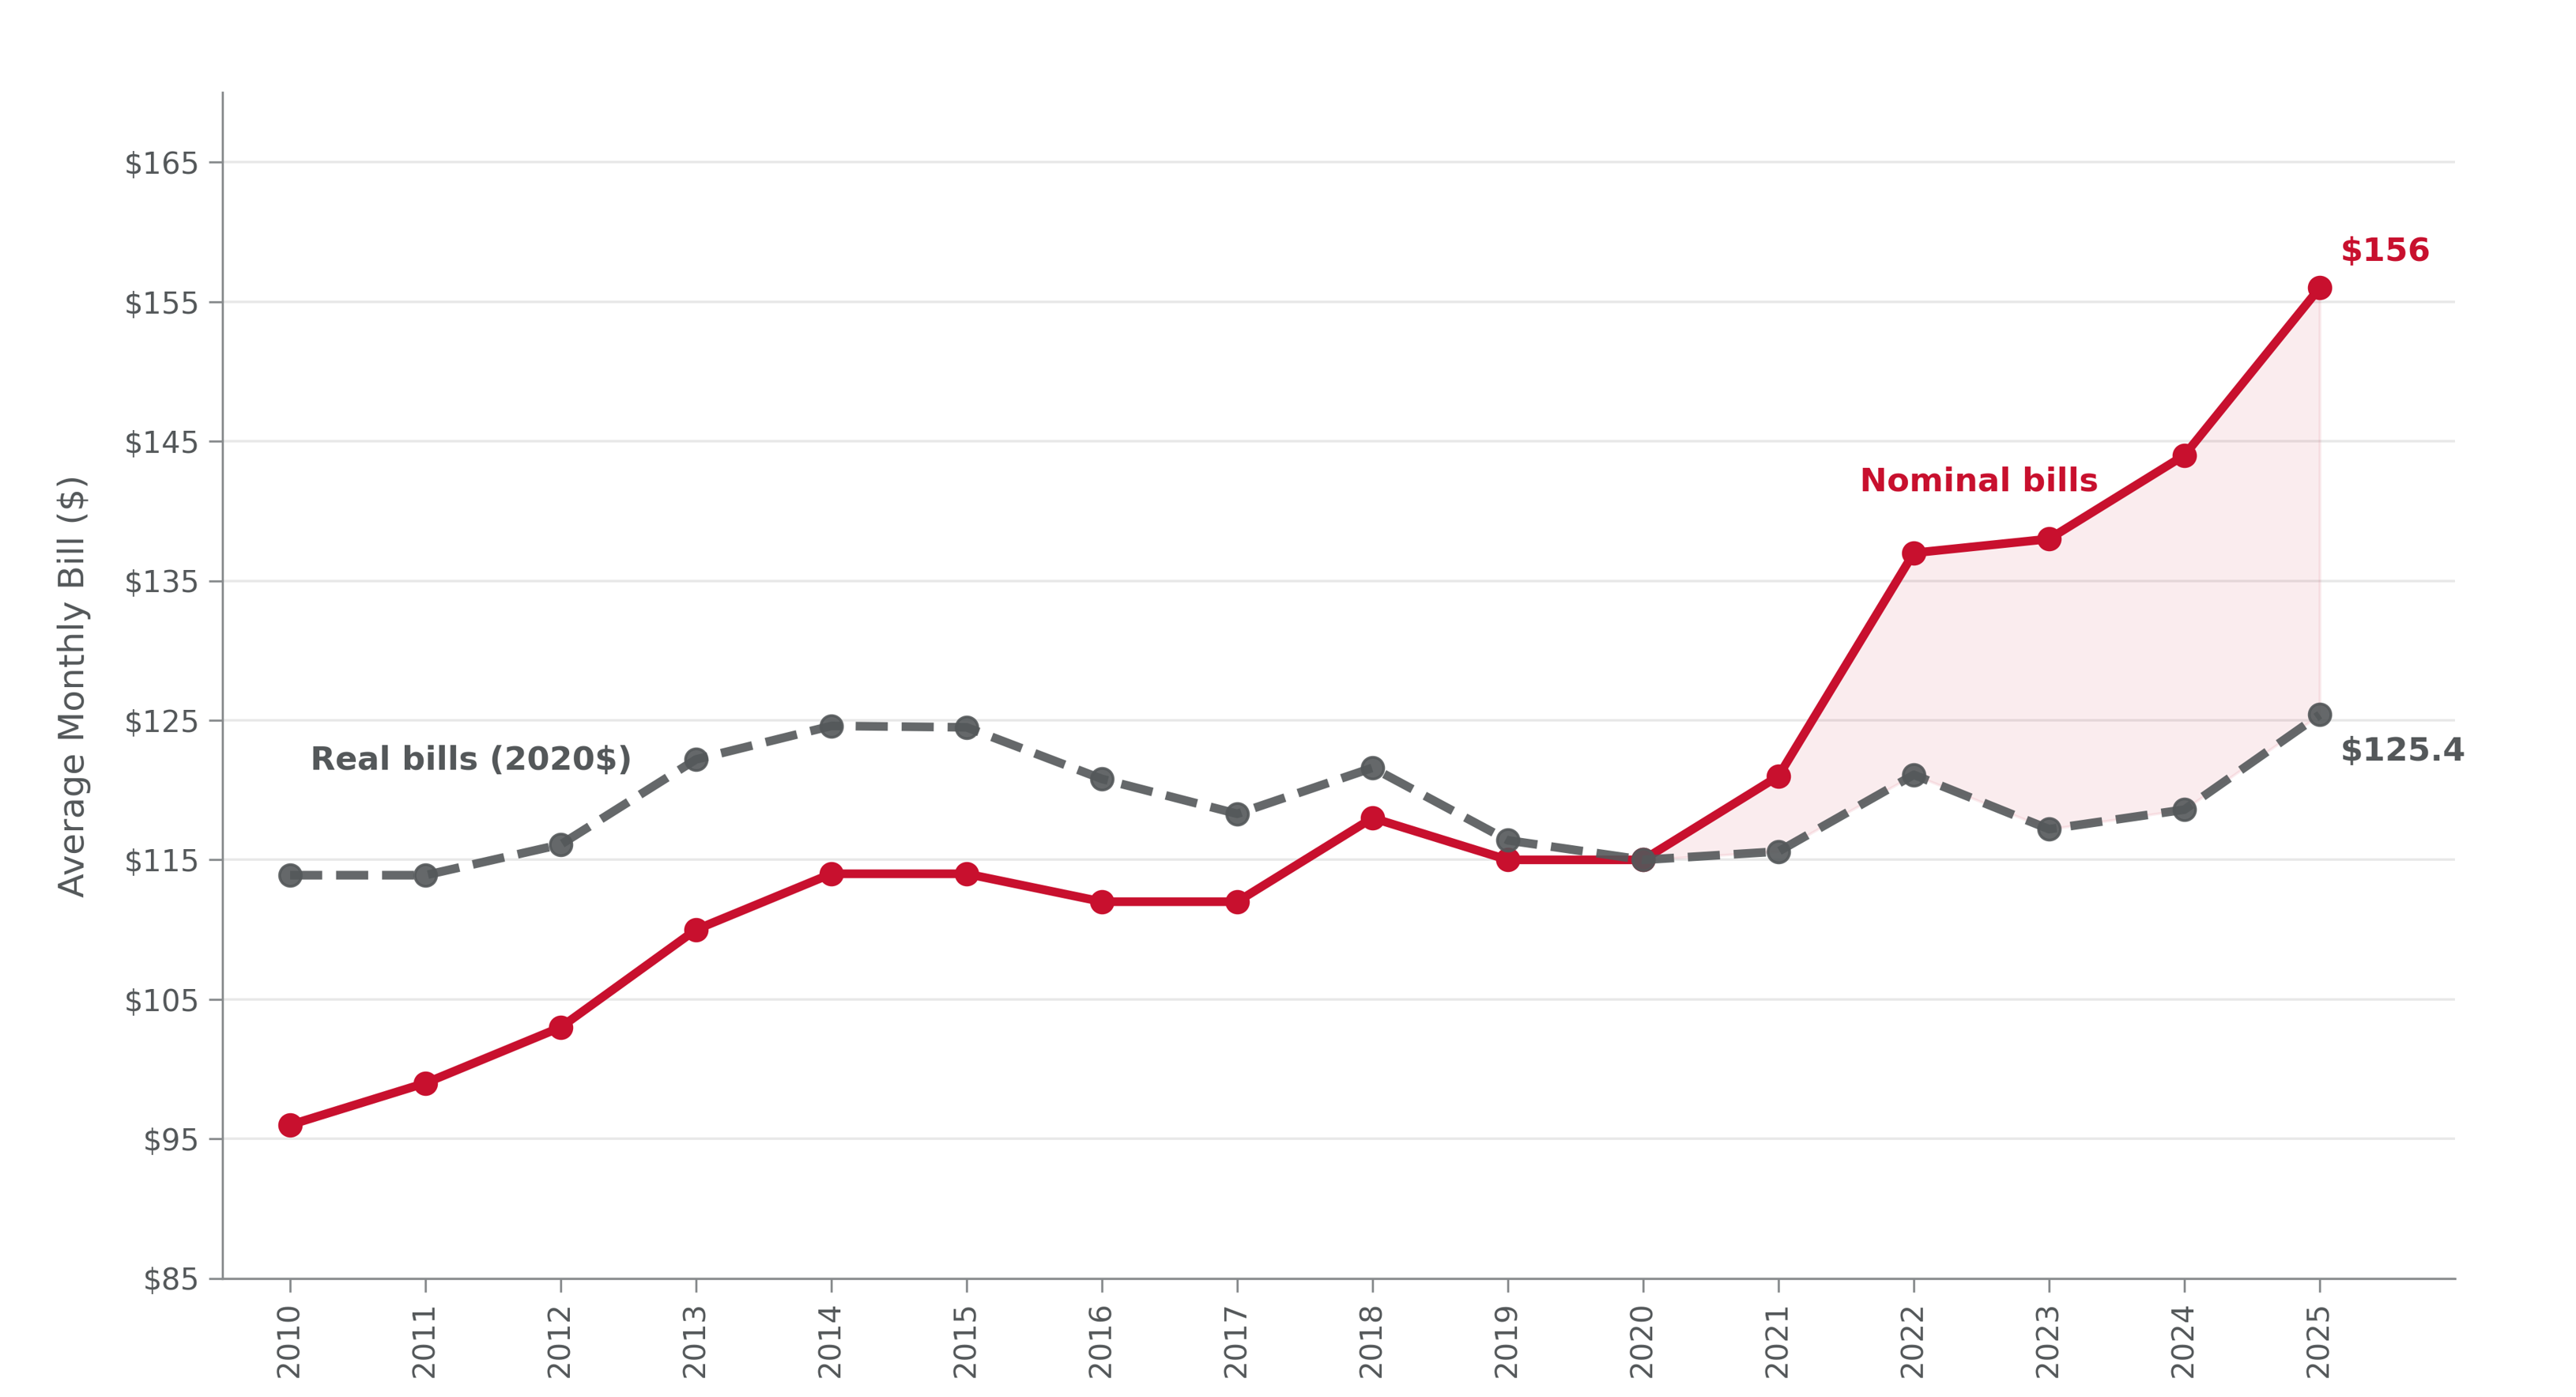
Data source: U.S. Energy Information Administration (EIA), Electric Sales, Revenue, and Average Price, Table 5A; 2025 estimate from National Energy Assistance Directors' Association (NEADA) based on EIA data.
Notes: Real bills are adjusted for inflation using the U.S. Bureau of Labor Statistics Consumer Price Index for All Urban Consumers (CPI-U), anchored to 2020 dollars. The 2025 CPI annual average is based on 11 months of data (October 2025 not released due to a federal appropriations lapse).
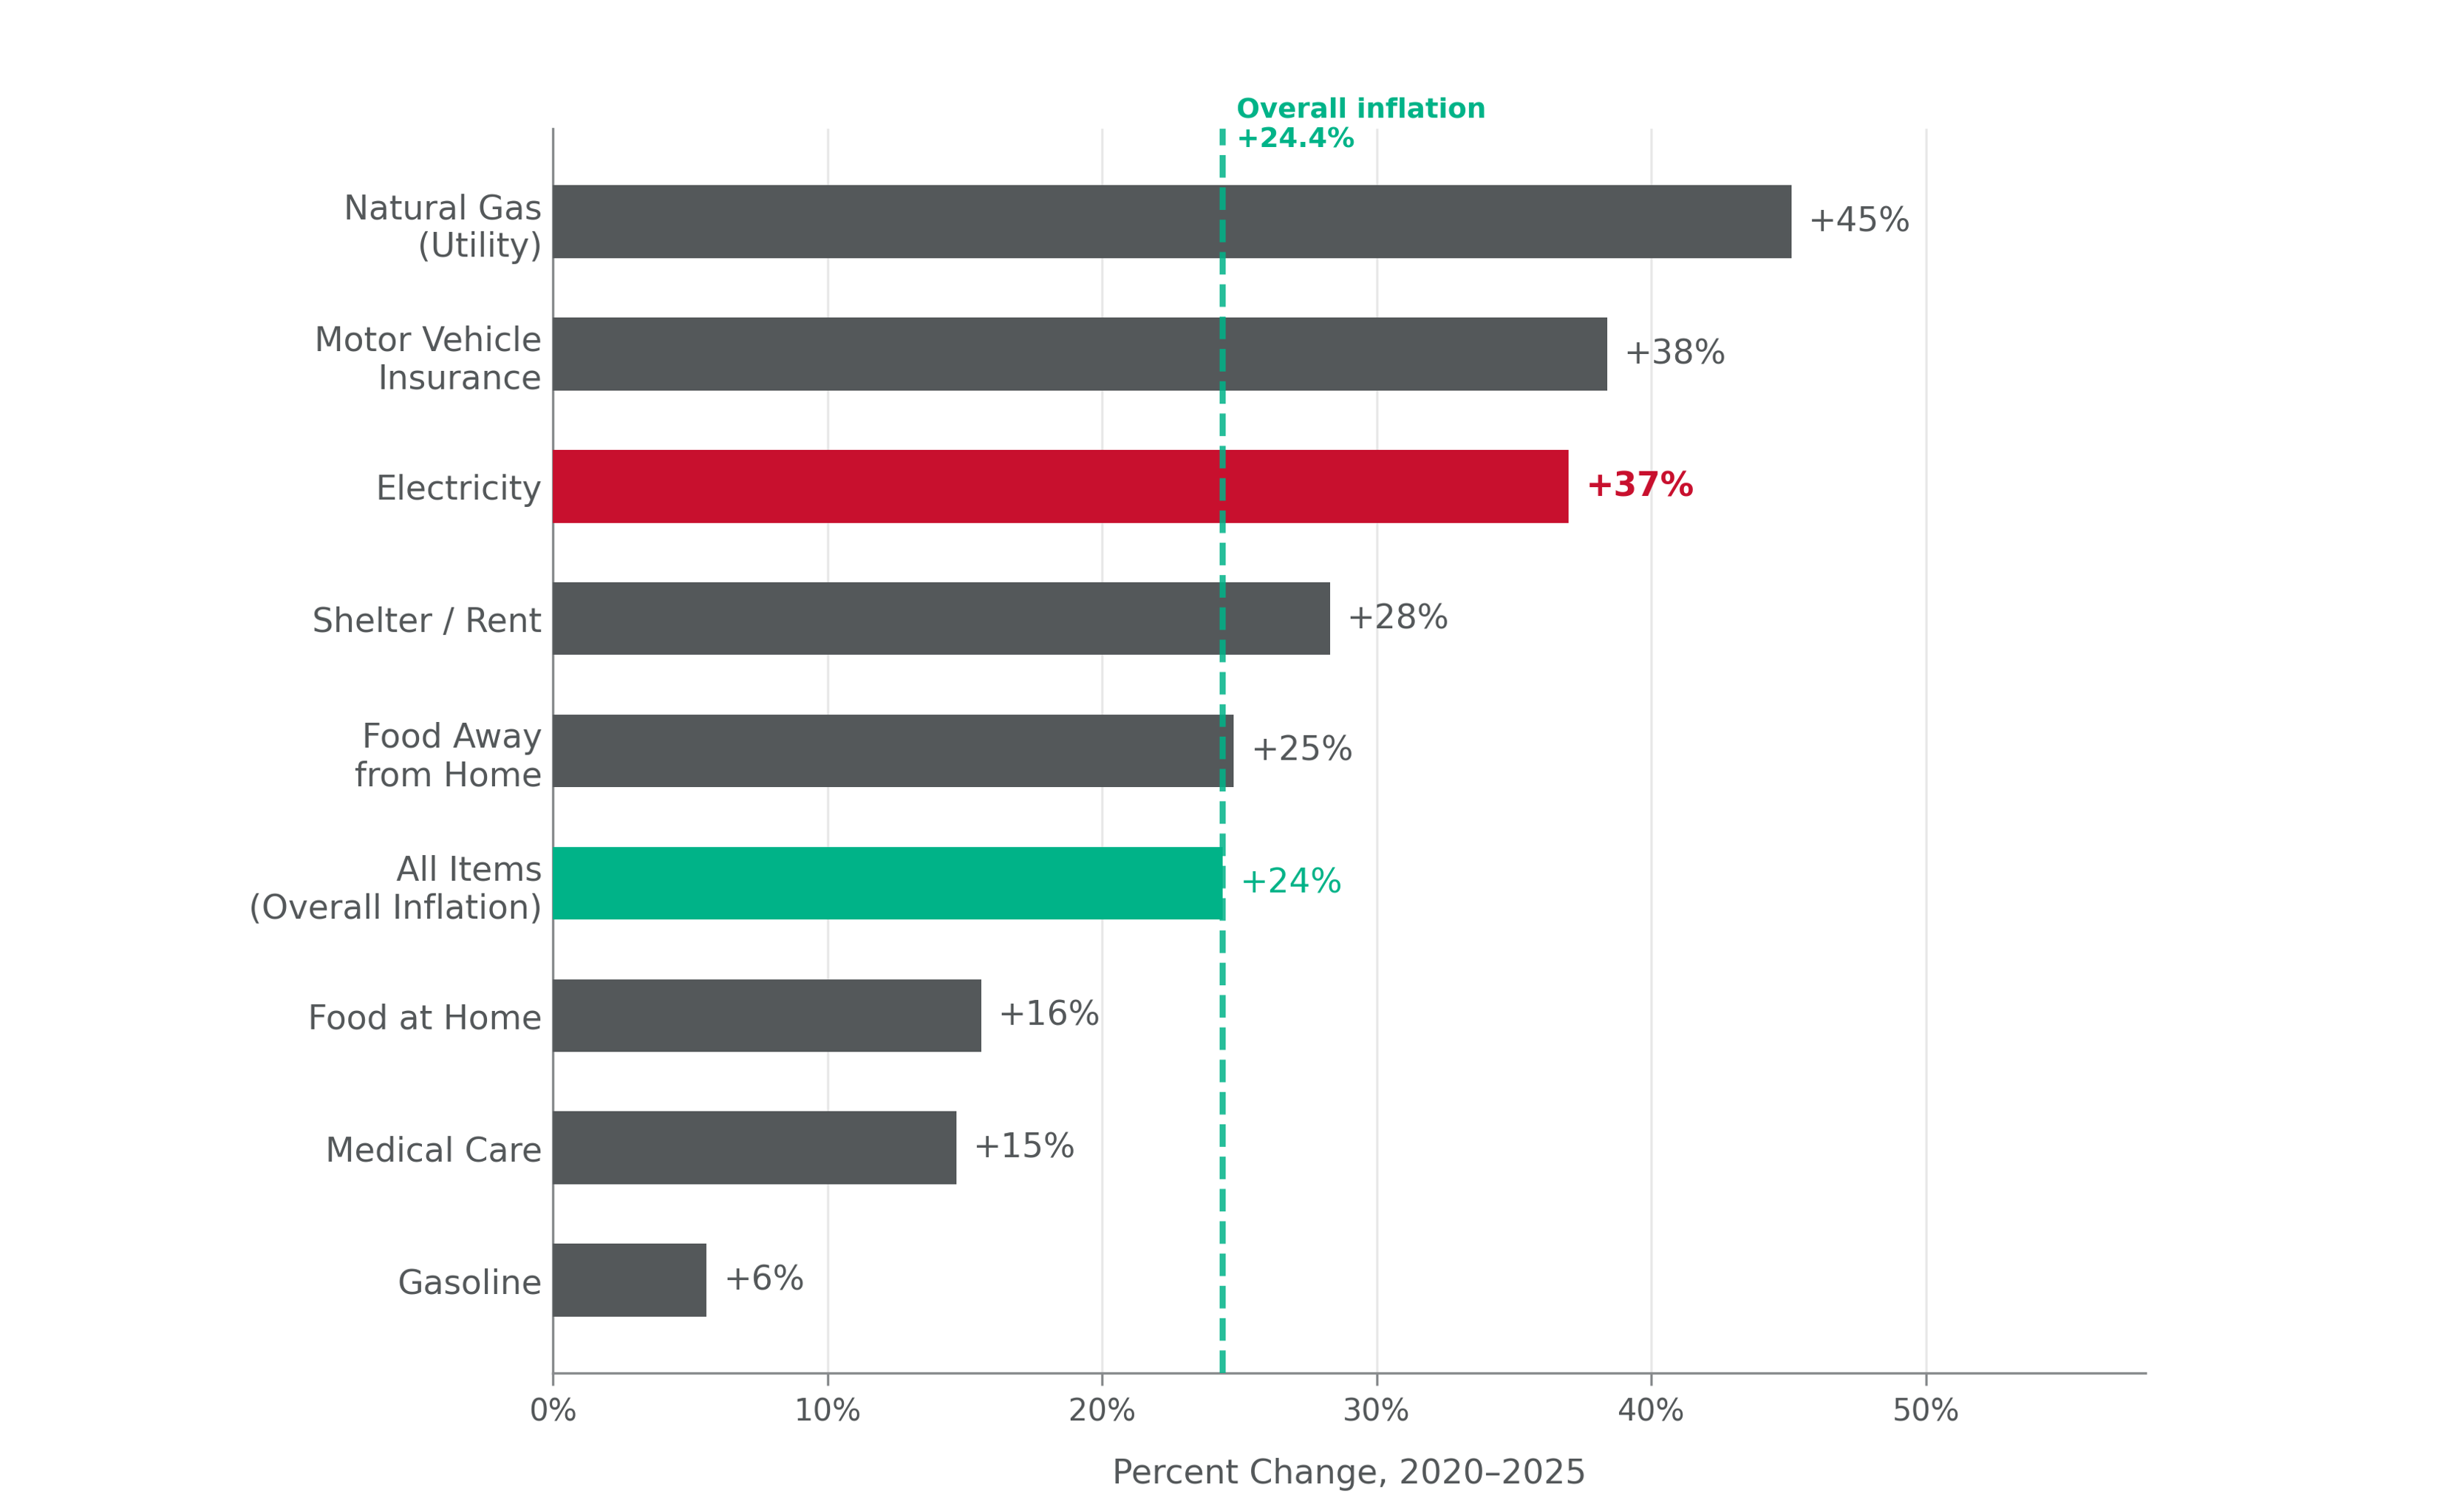
Data source: U.S. Bureau of Labor Statistics (BLS), Consumer Price Index for All Urban Consumers (CPI-U). Motor vehicle insurance premium estimate based on BLS CPI motor vehicle insurance index; car insurance dollar figures from Insurance Information Institute.
Notes: Percent changes calculated from annual average CPI-U index values, 2020 to 2025. The "Overall Inflation" benchmark reflects the All Items CPI-U, representing the average change across all consumer goods and services. Bars above the teal reference line indicate categories where price growth exceeded overall inflation during this period. 2025 values are estimates based on available monthly data through late 2025; the October 2025 CPI release was not published due to a federal appropriations lapse.
For millions of households, unaffordable electricity leads to a cascade of hardships.
Research from the Texas Trends Survey, conducted by the Hobby School of Public Affairs at the University of Houston, captures this. Nearly one in three Texas households faces what researchers call a "high energy burden", meaning they spend 7% or more of their income on electricity alone.
Nearly 20% of Texans have at some point had to choose between paying their electricity bill and affording food, medication, or rent. For many, these are not one-time emergencies: 39% struggled to pay their energy bills in the past year, and 21% experienced such hardship at least three times.
Neither are these burdens distributed evenly. For example, rural households, particularly in West and South Texas, report higher burdens than those in large metropolitan areas, which is a pattern that maps directly onto the state's most impoverished regions. People in older homes are especially exposed: about 40% of those in homes built 60 or more years ago spend at least 7% of their income on electricity, because aging buildings mean worse insulation, less efficient systems, and higher bills.
For many of these households, the obvious solution, such as weatherizing the home, upgrading the HVAC system, and installing solar panels, is financially out of reach. Upfront costs, credit barriers, and language barriers prevent many from accessing assistance programs; also, the fact that many are renters means that the people who would benefit most from efficiency upgrades are least able to obtain them.
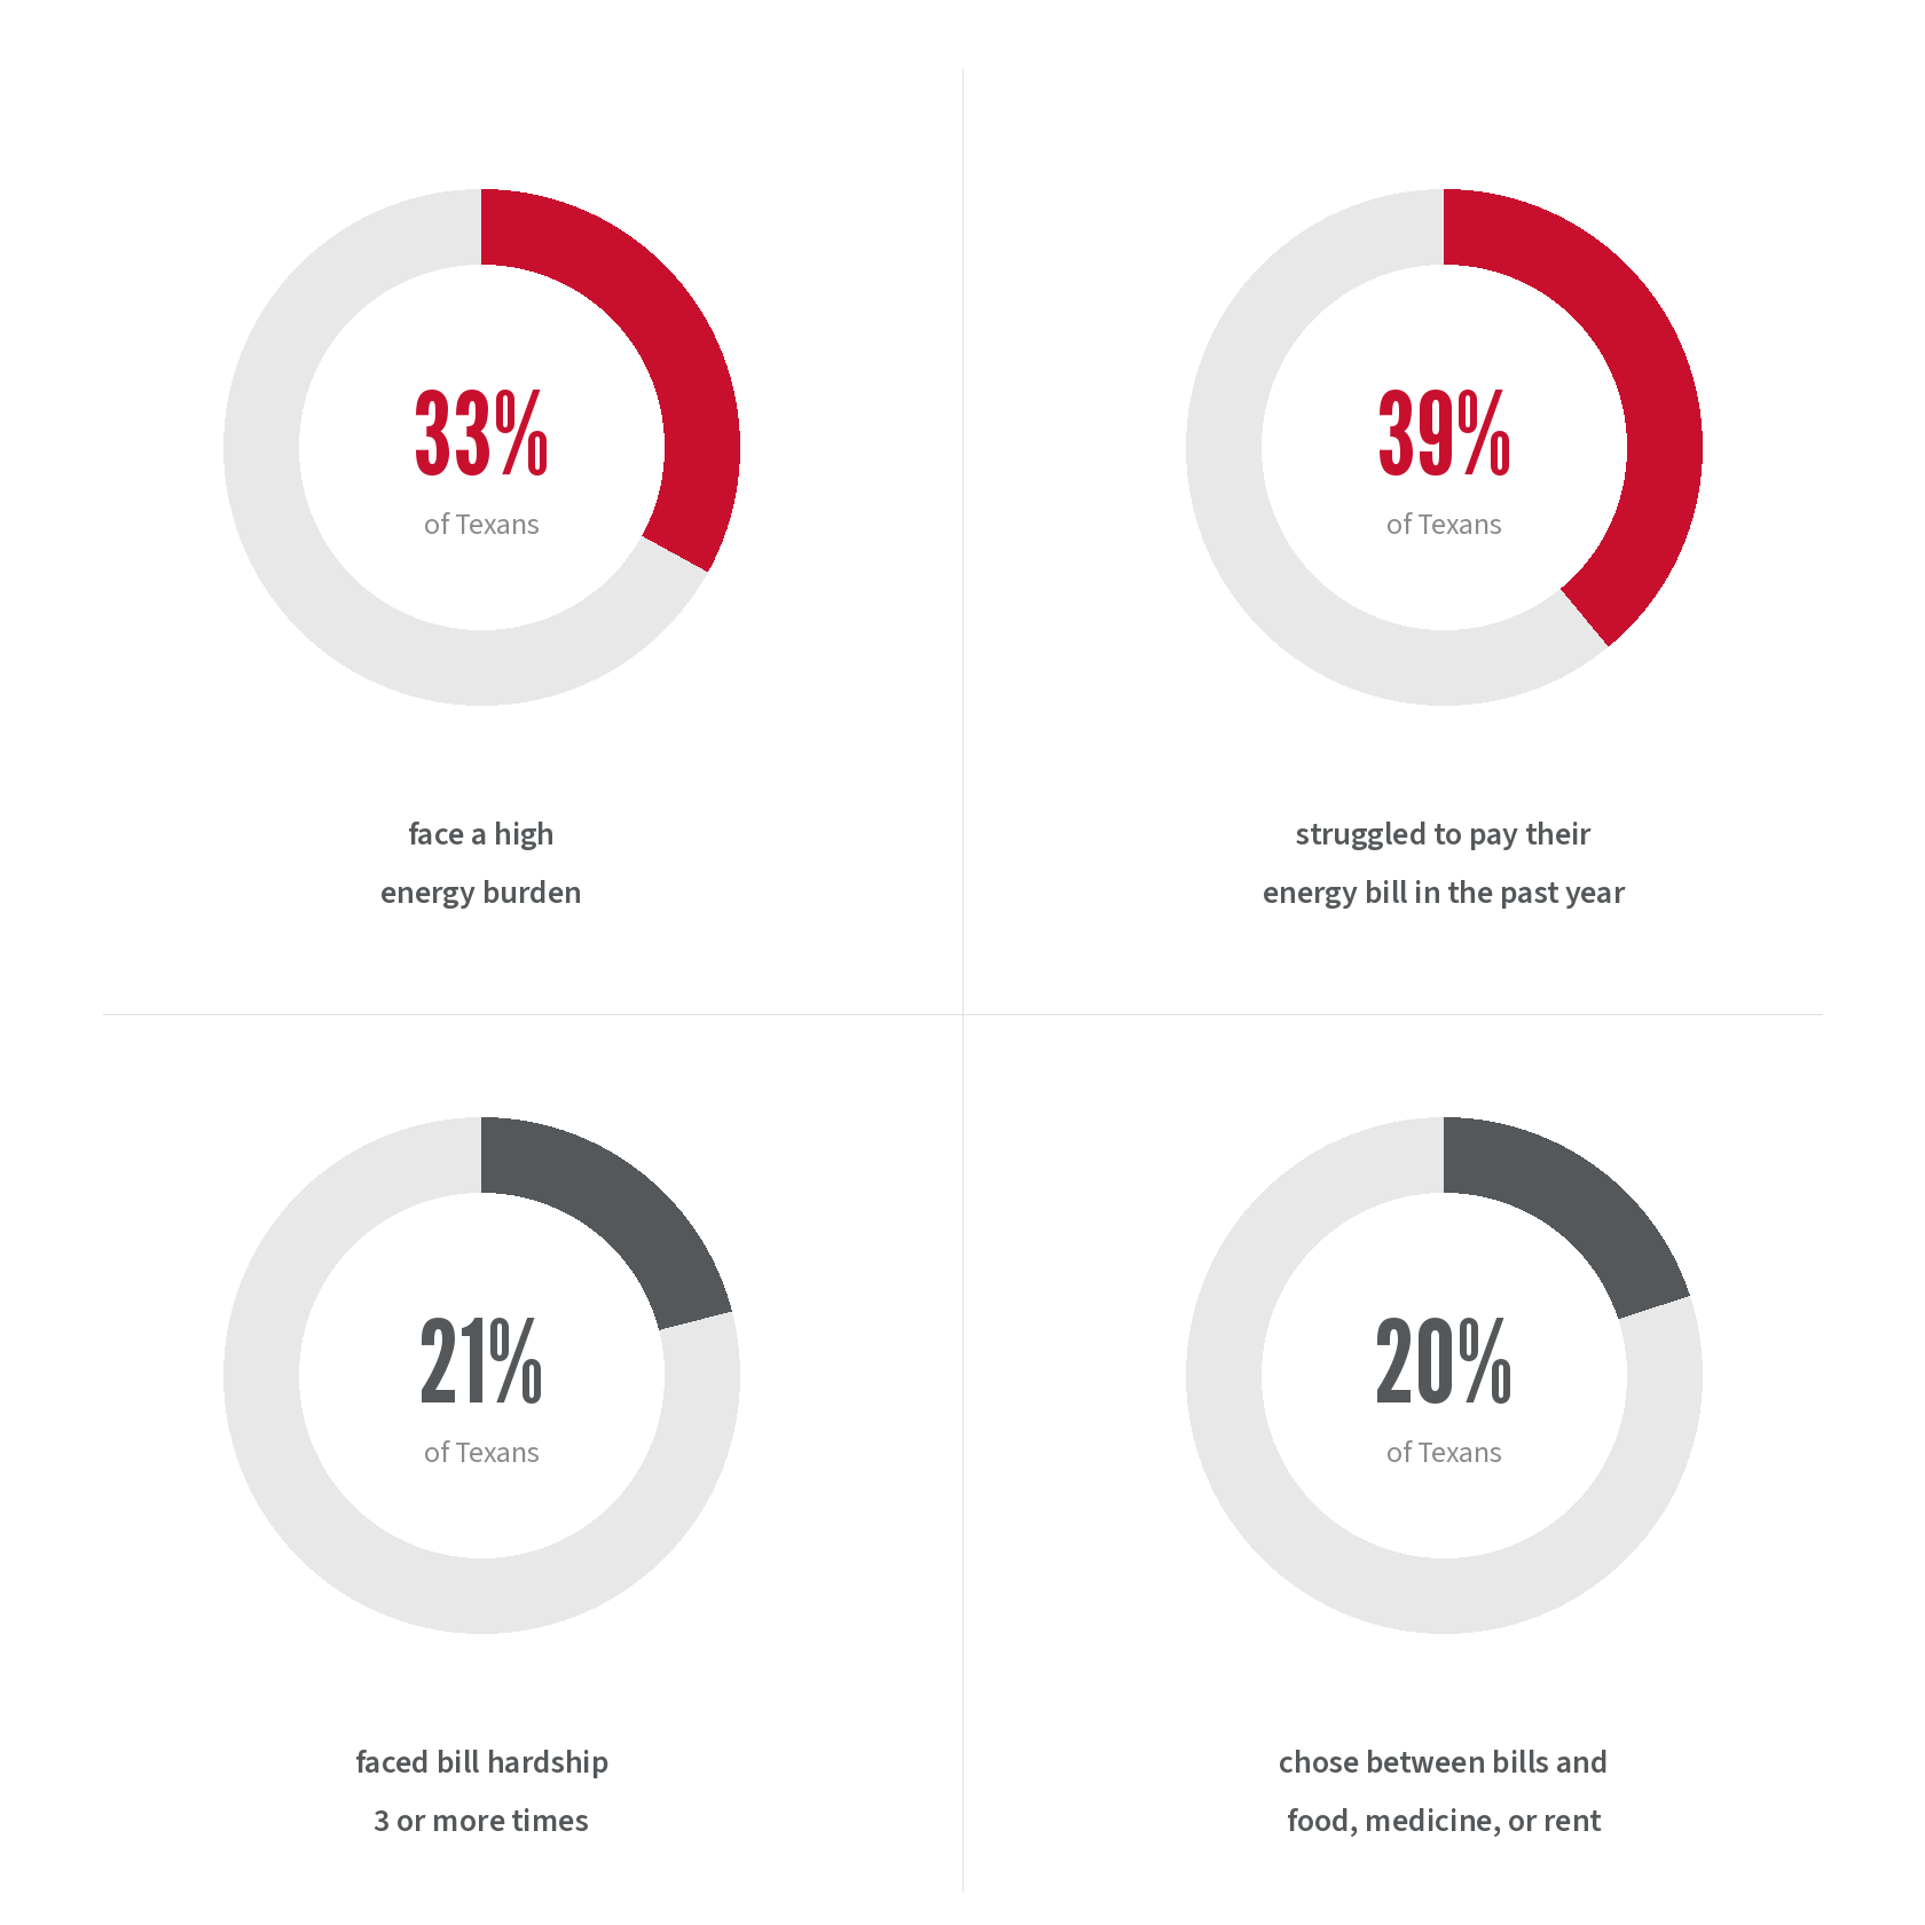
Data source: 2025 Texas Trends Survey, Hobby School of Public Affairs, University of Houston.
Notes: "High energy burden" is defined as spending 7% or more of household income on electricity costs, a threshold established by the U.S. Department of Energy. Survey data reflect self-reported household experiences. Figures represent the share of Texas households surveyed; results may not sum due to rounding.
A New Era for Electricity Costs
Texas finds itself at an uncomfortable crossroads. It is the nation's largest energy producer, accounting for roughly 42% of U.S. crude oil and 27% of natural gas production. Yet its households pay some of the highest electricity bills in the country. Houston, where our research is based, illustrates the tension at its sharpest.
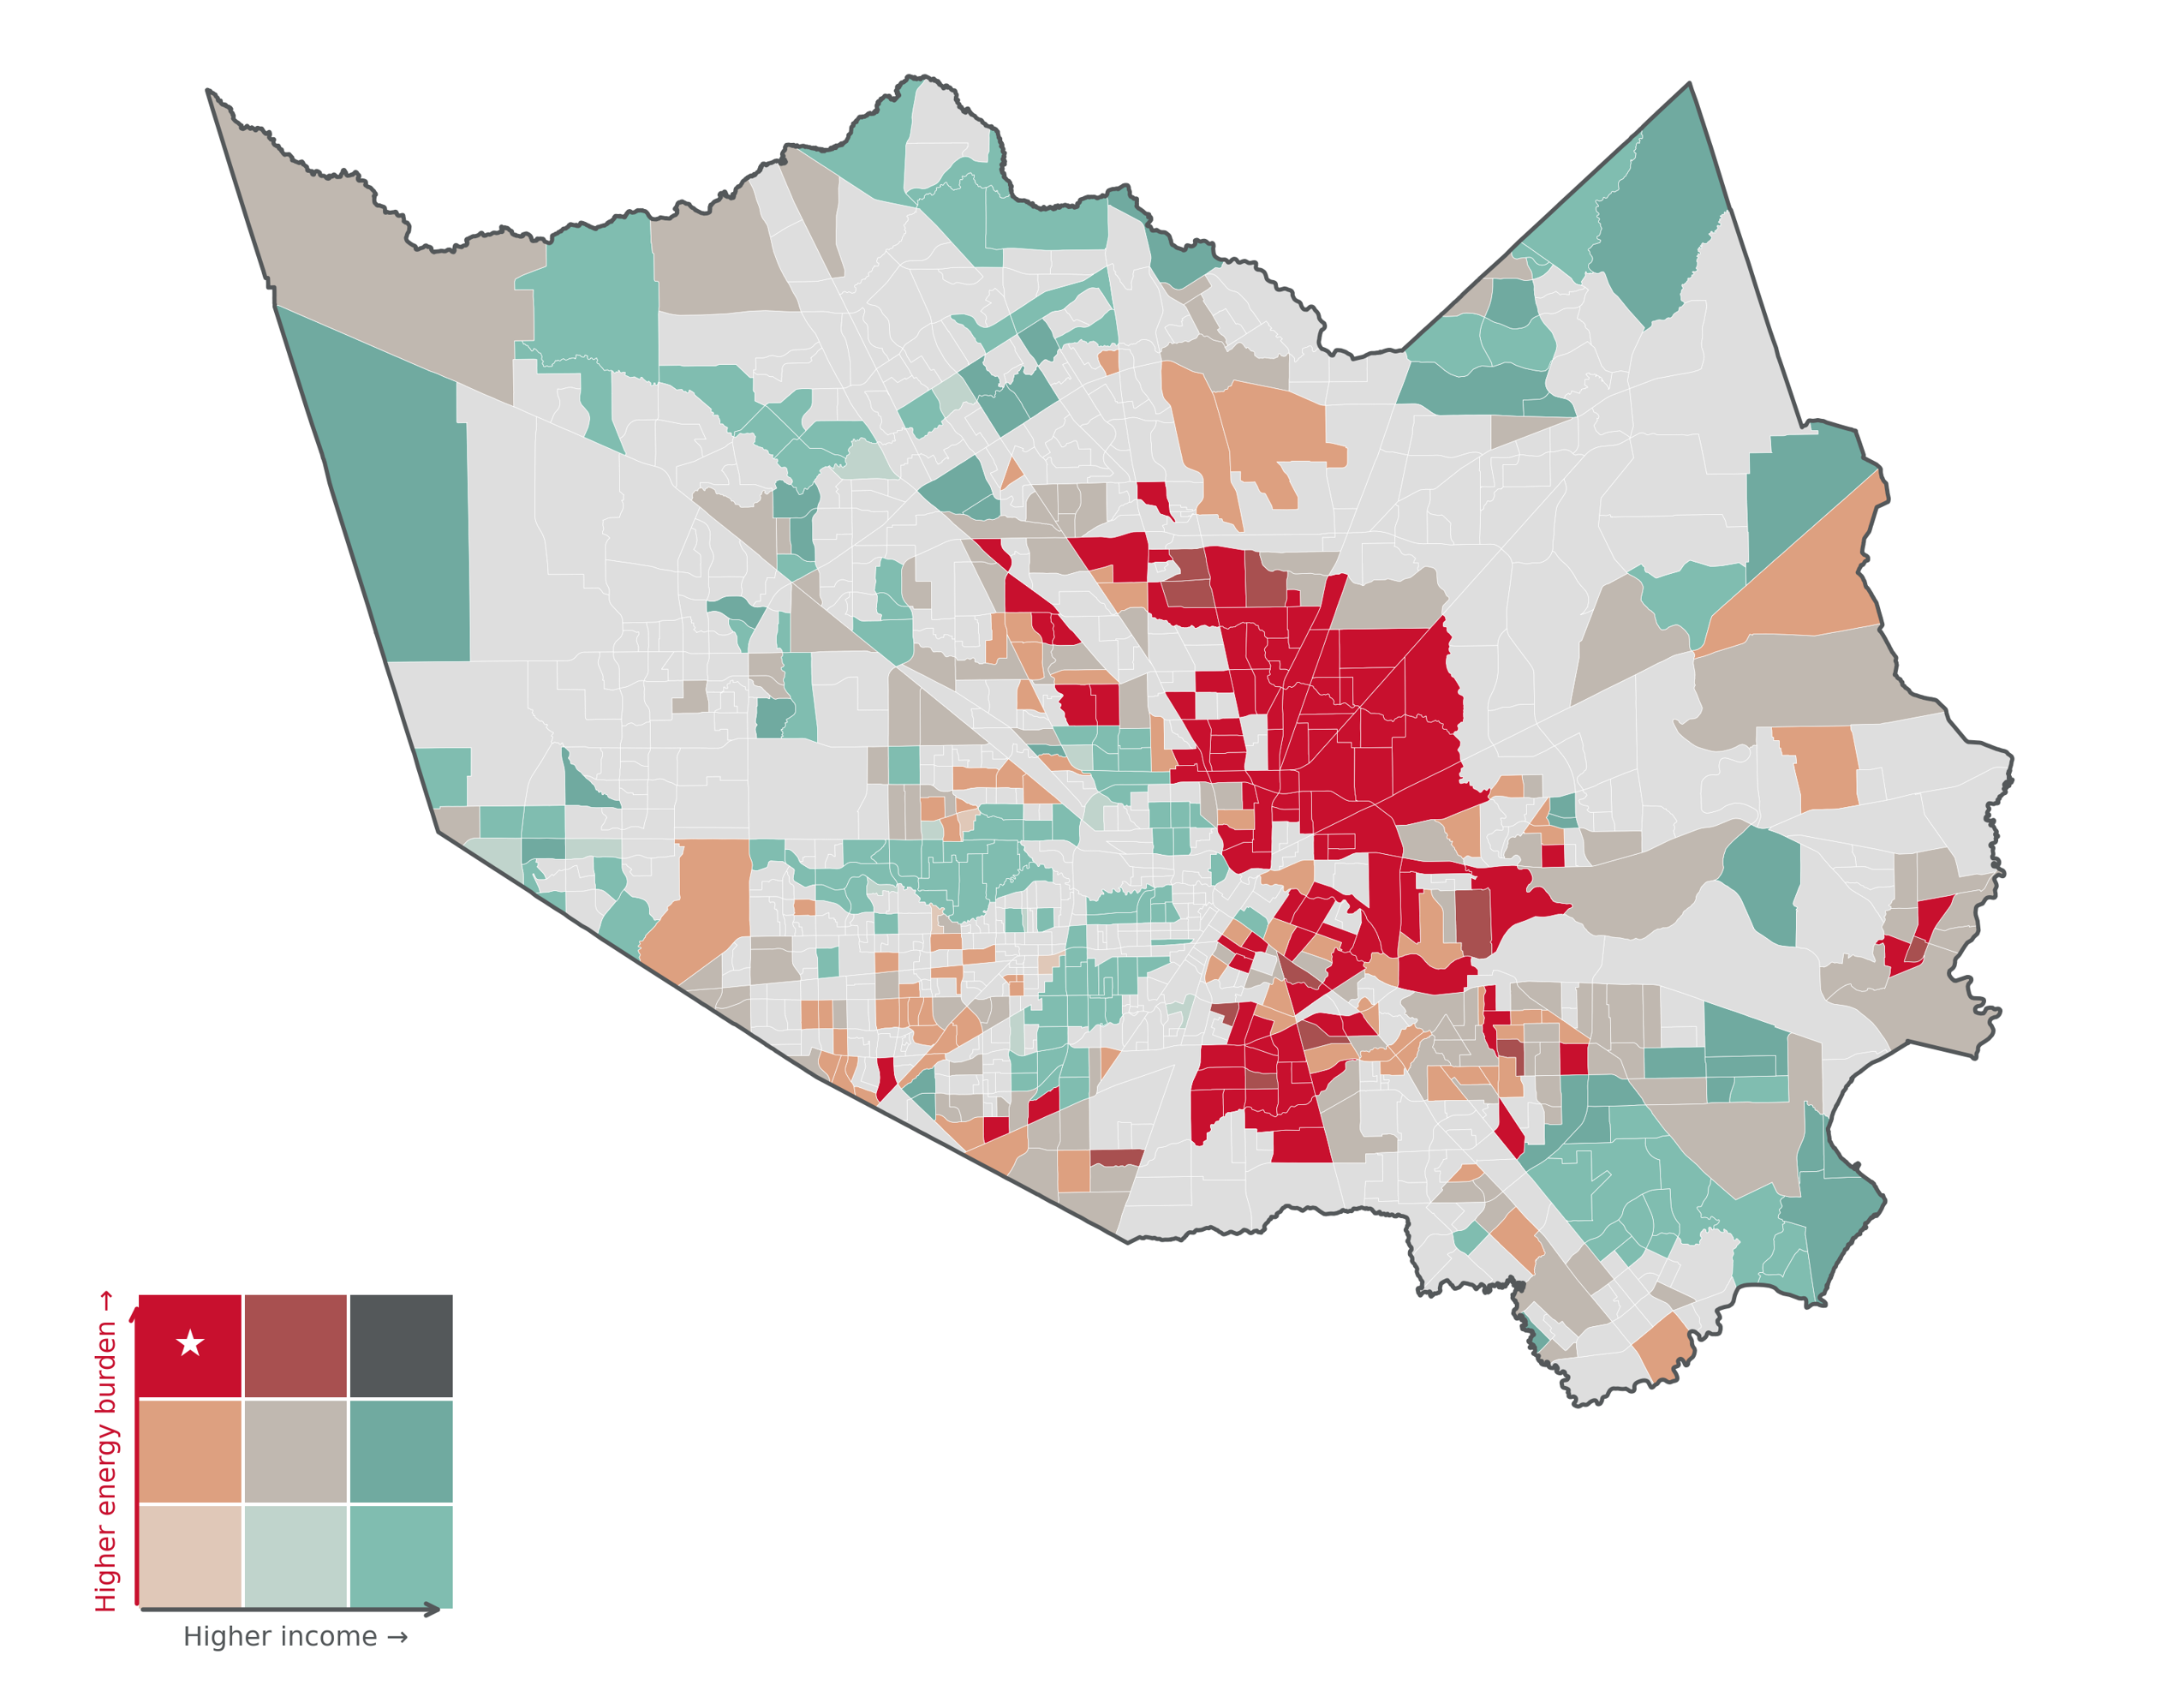
Data source: Census Bureau TIGER/Line Shapefiles (2022); Climate and Economic Justice Screening Tool (CEJST) v2.0, Council on Environmental Quality, Executive Office of the President.
Notes: Each census tract is classified along two dimensions simultaneously: median household income as a percentage of Area Median Income (AMI) and residential energy burden. Income categories: Low (<70% AMI), Medium (70–110% AMI), High (>110% AMI). Energy burden categories: Low (<2% of income), Medium (2–4%), High (>4%). The starred cell identifies tracts with both low income and high energy burden. Gray tracts indicate insufficient data. Energy burden is defined as the average share of household income spent on energy costs.
In much of the state, the electricity market is deregulated such that consumers can choose their electricity provider and, in theory, benefit from competition. In practice, however, competition has not acted as a buffer against structural cost increases passed on to households. Since Winter Storm Uri in February 2021, electricity rates in the Houston area have risen by over 25%. The rate hikes have come on the backs of utilities investing in storm-hardening measures, including burying power lines, adding backup generators, and making grid-resilience improvements. Consumers directly pay for these investments in the form of T&D charges, regardless of whether the household benefits from the improvements.
Houston is not alone. Similar dynamics play out across Gulf Coast cities. In New Orleans, non-generation costs account for approximately 80% of a residential electricity bill. In Tampa, T&D charges account for nearly half. Each city faces its own version of the same structural problem: a grid built for another era, now being rebuilt at ratepayer expense, with the cost burden falling hardest on those least able to pay.
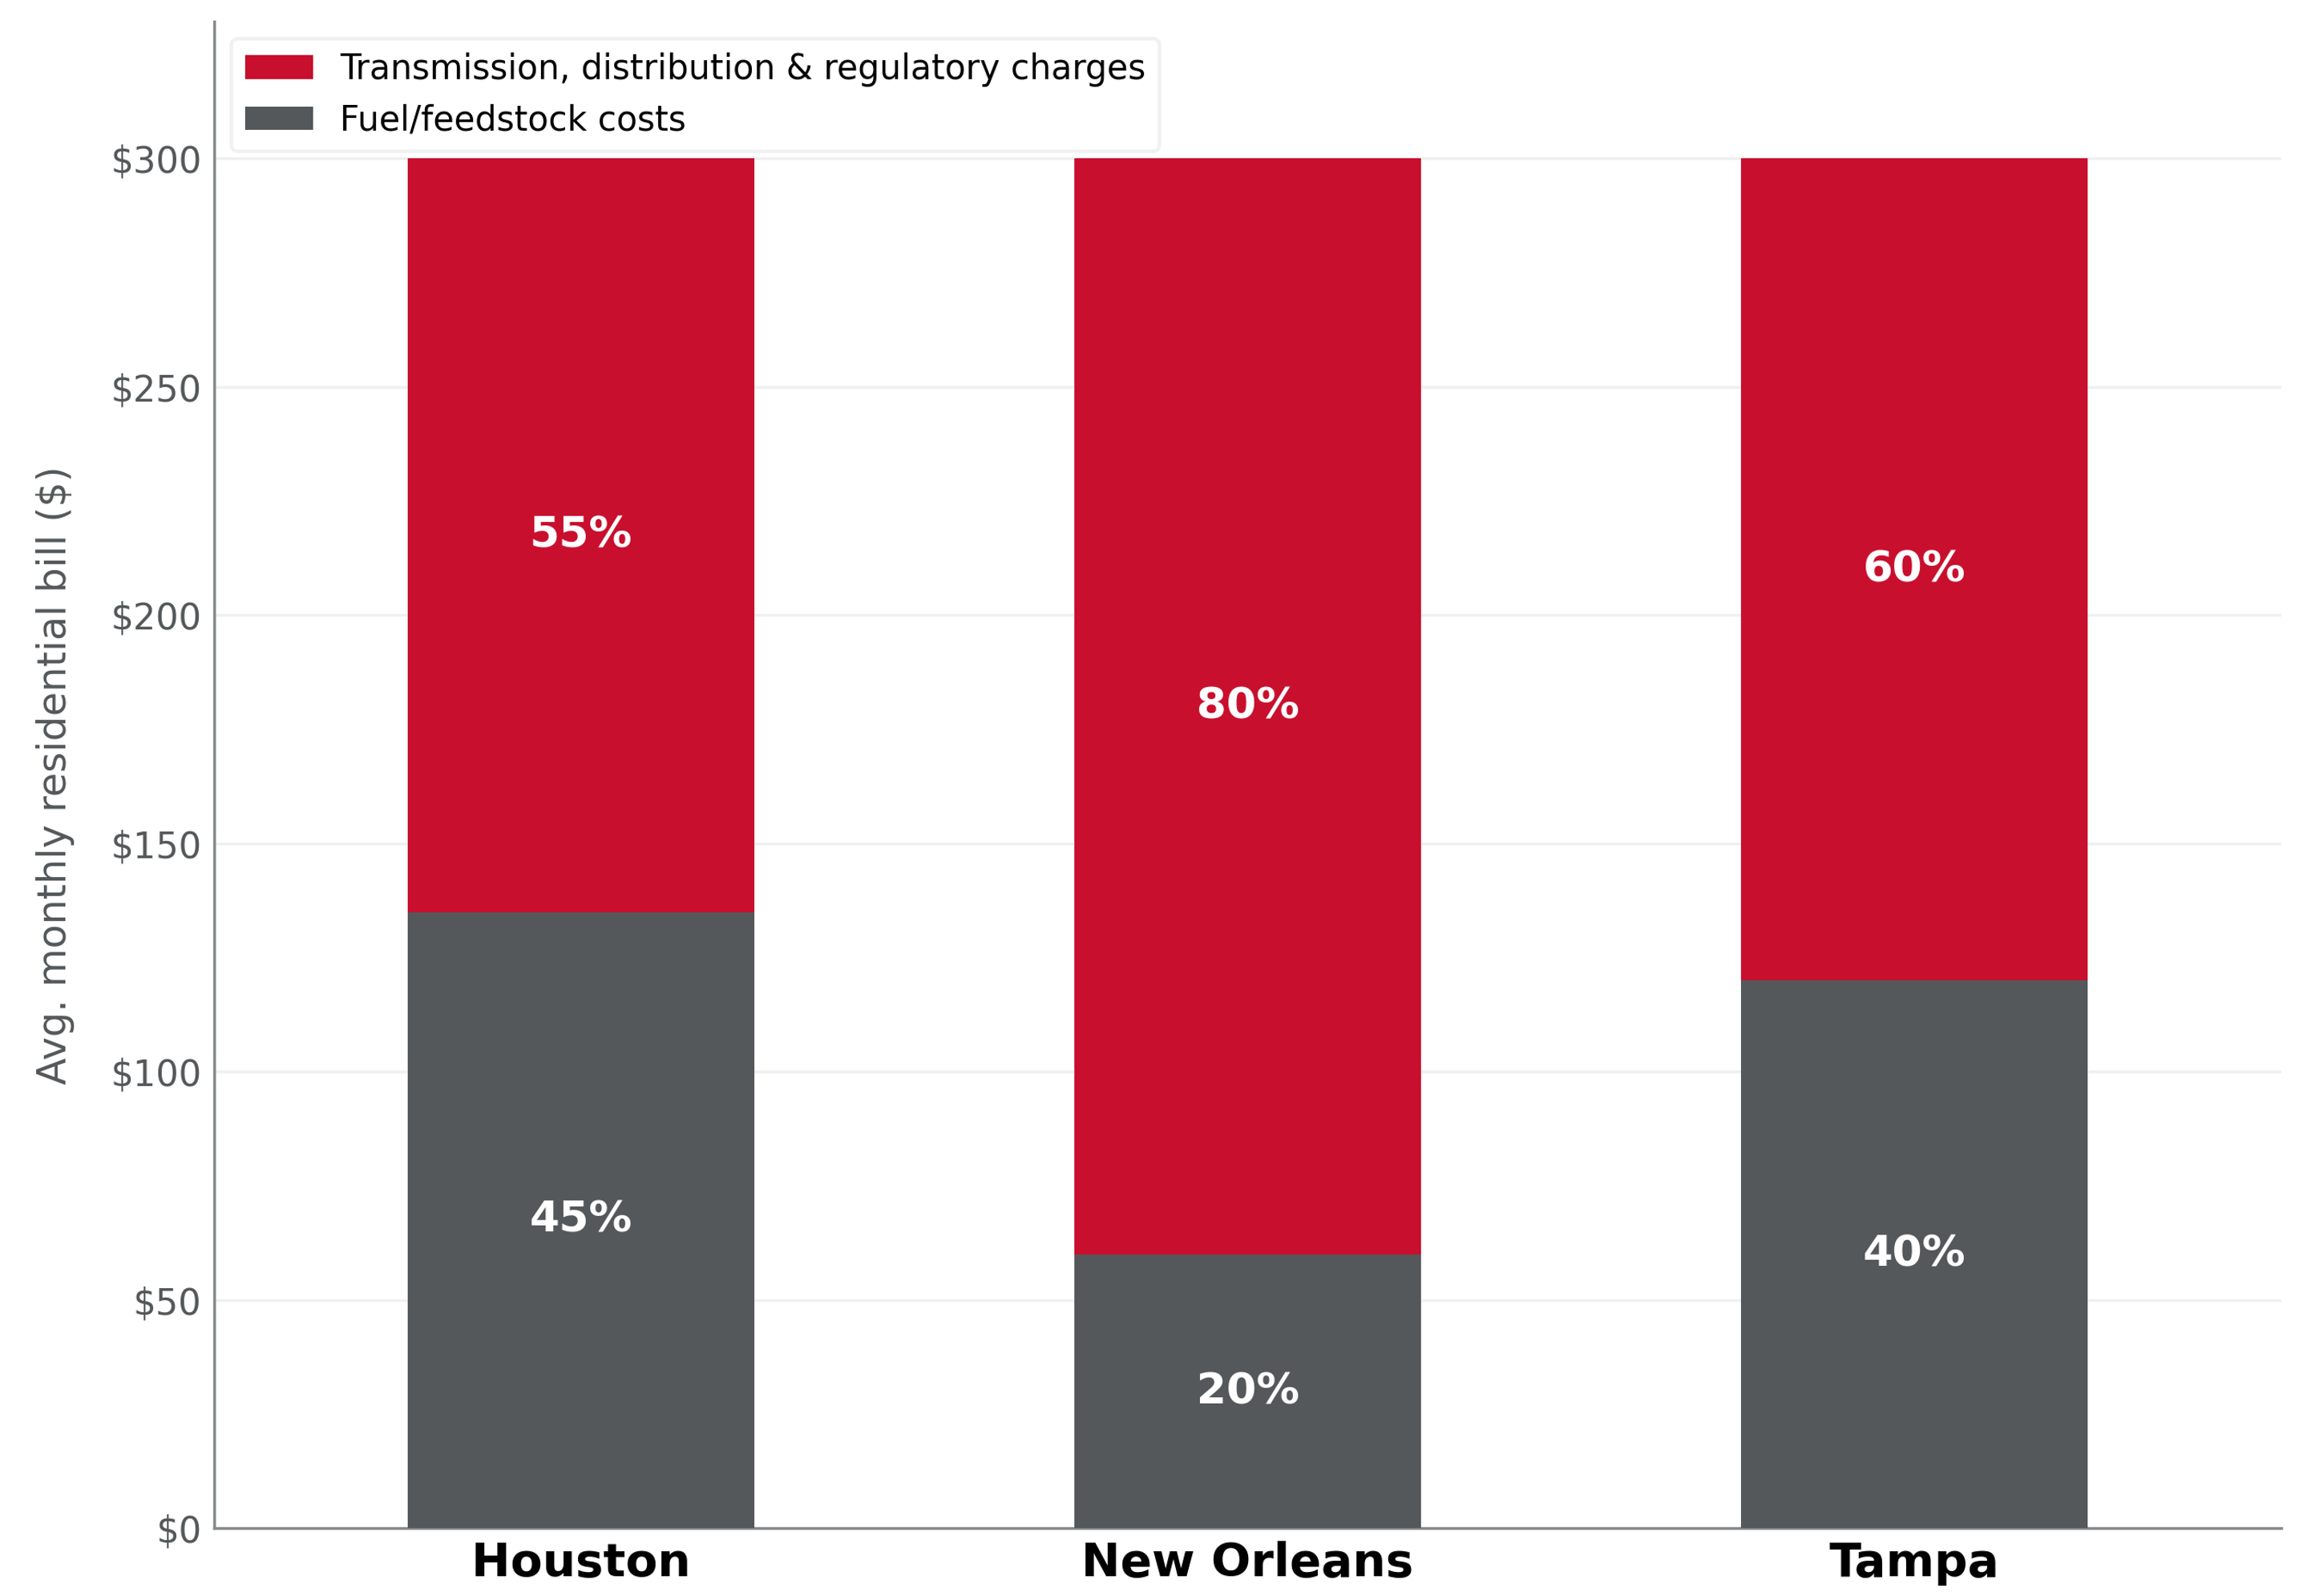
Data source: Krishnamoorti and Datta (2025), "The Electricity Costs We Don't Talk About," UH Energy Perspectives, University of Houston.
Notes: Bill composition reflects the estimated share of average monthly residential electricity bills attributable to fuel/feedstock costs versus transmission, distribution, and regulatory charges (including storm-hardening investments, grid infrastructure upgrades, and regional transmission organization fees).
Growth and the 2035 Outlook
Texas's electricity challenges are not the result of investment or policy misfortune alone. They are also a product of scale and speed.
Electricity consumption in Texas has grown at an average annual rate of 2.5% since 1999, driven by population growth, urbanization, industrial expansion, and, increasingly, by new and energy-intensive technologies. The state consumed ~500 terawatt-hours of electricity in 2024, with the average Texas household using about 14,000 kilowatt-hours per year, roughly 26% higher than the national average.
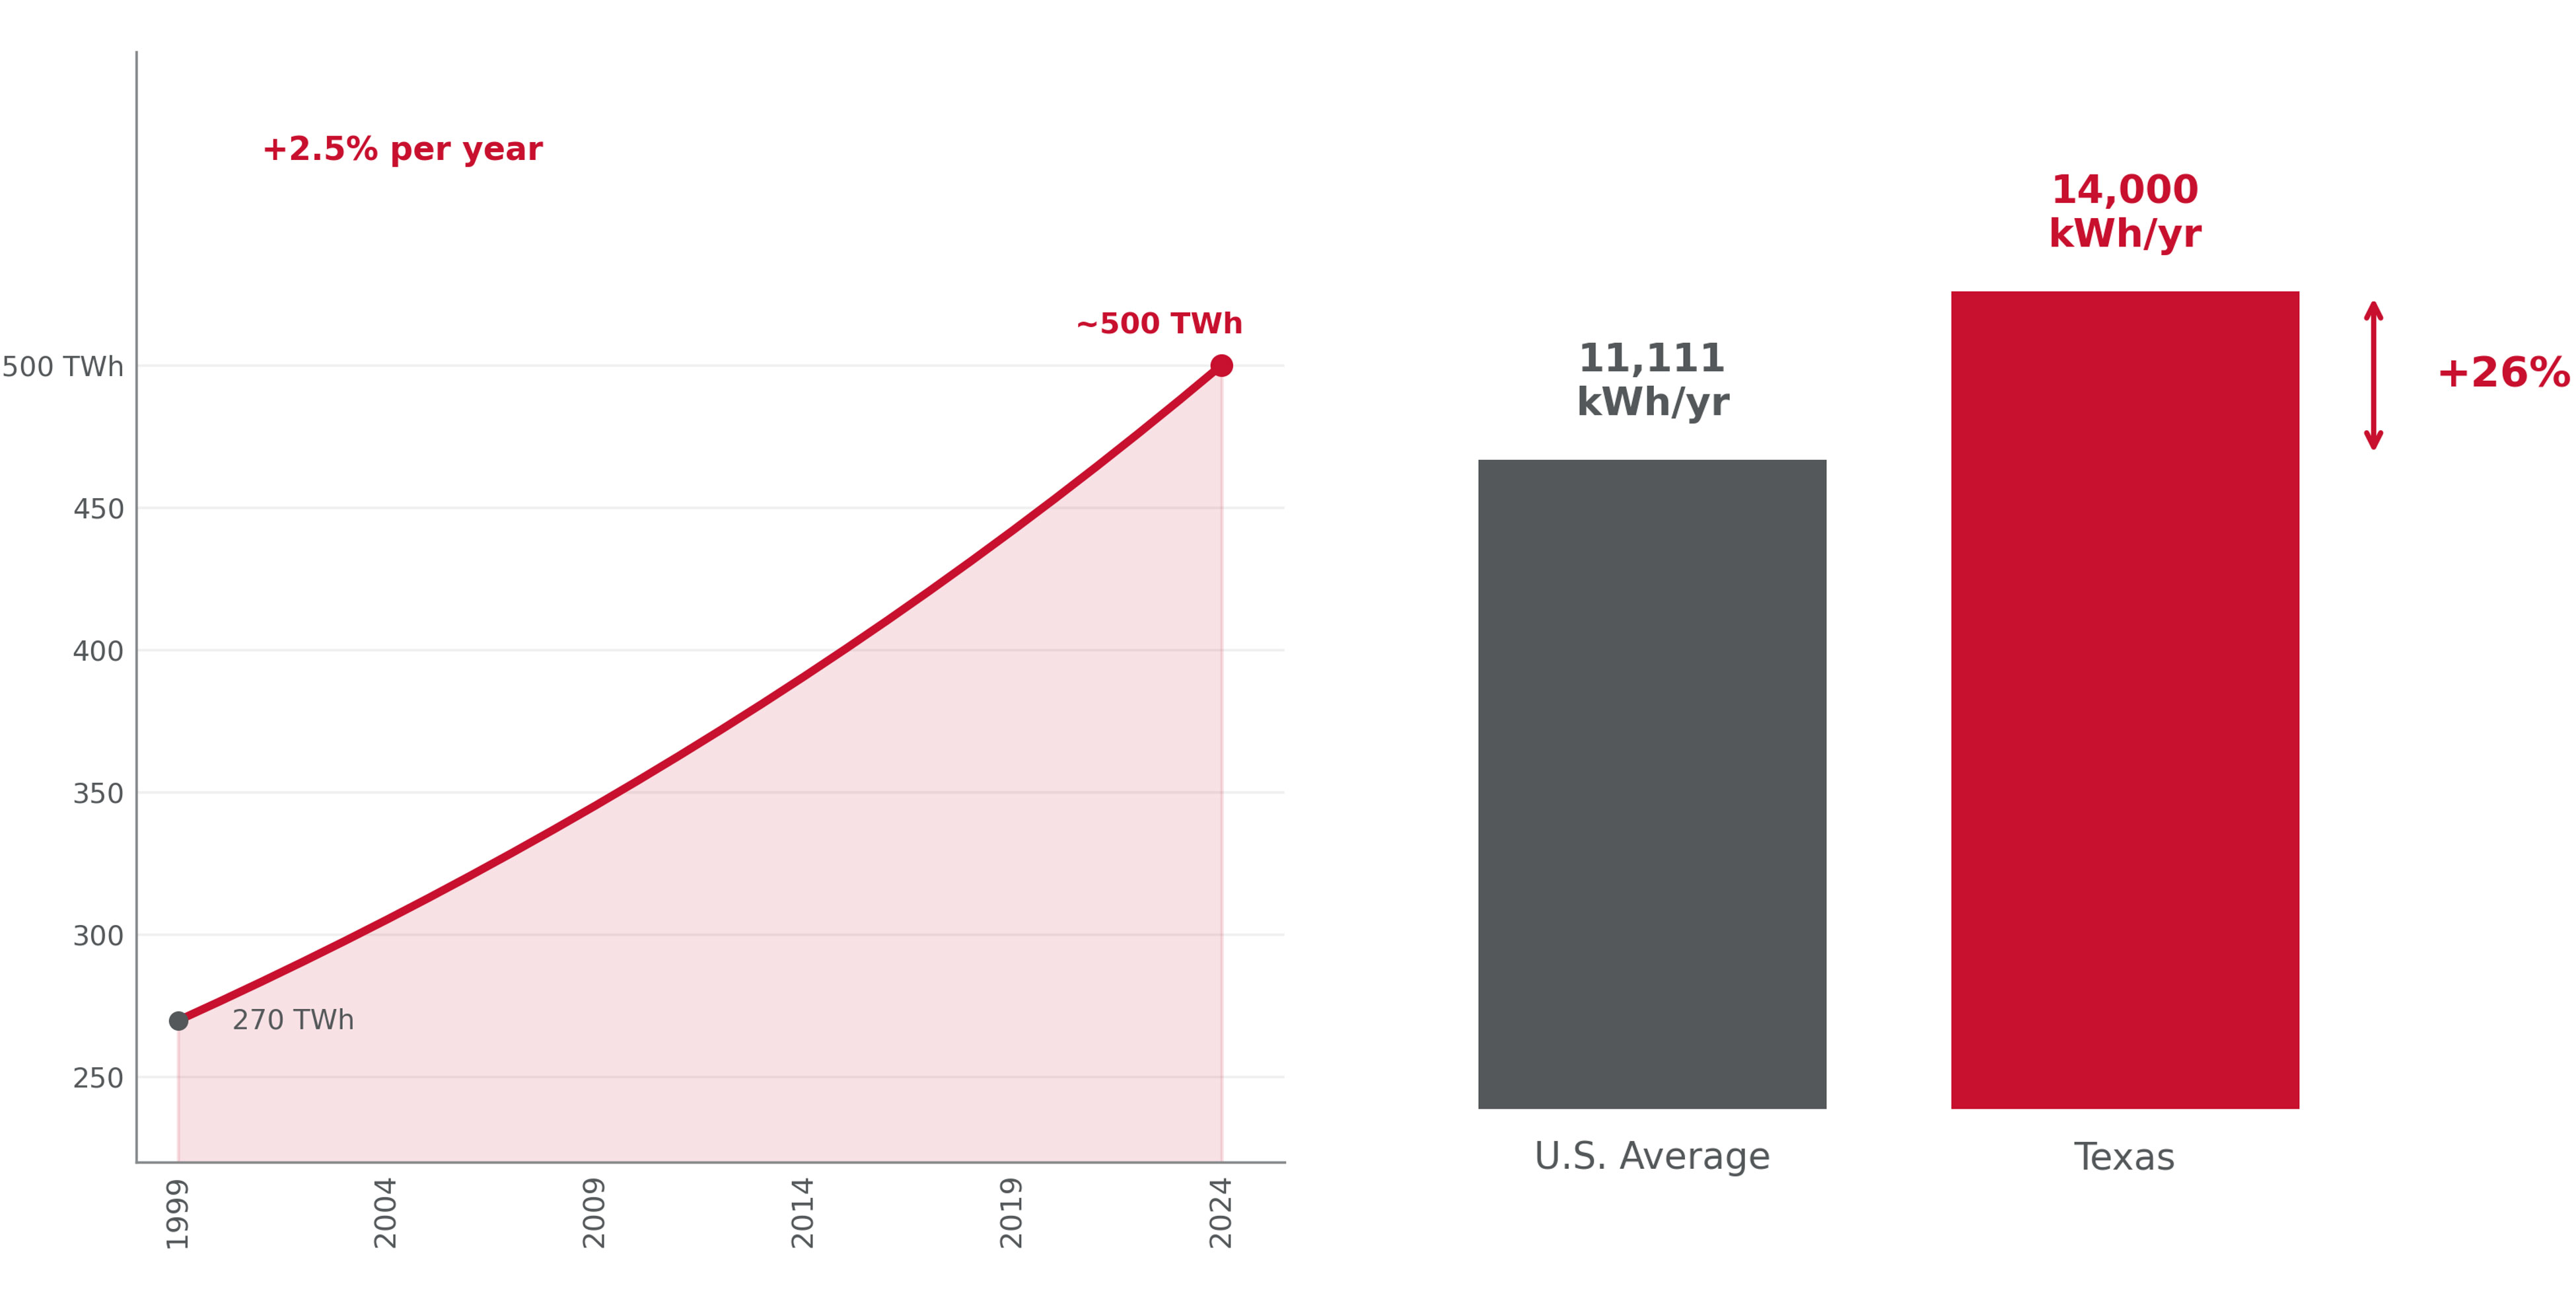
Data source: U.S. Energy Information Administration (EIA), State Electricity Profiles and Electric Power Annual. Per-household consumption comparison based on EIA residential electricity sales data.
Notes: Total electricity consumption reflects statewide retail sales in terawatt-hours (TWh). The 1999–2024 trend line is based on an average annual growth rate of 2.5%. The average Texas household consumes approximately 14,000 kWh per year, roughly 26% above the national average of approximately 11,100 kWh.
Forecasting the Supply Deficit
Our modeling projects that without significant new generation and transmission investment, Texas will face an annual electricity supply deficit of up to 40 gigawatts by 2035, and more likely around 27 gigawatts under moderate scenarios.
To put that in perspective: 27 gigawatts is roughly equivalent to Louisiana's entire electricity-generating capacity during peak summer. The deficit is likely to emerge not because Texas is failing to add generation, but because demand from data centers and industrial loads is growing far faster than supply can keep up.
The geography mismatch of supply and demand centers in the state compounds the challenge. The data centers driving much of the new electricity demand are clustering in West, Far West, and North Texas. These are regions with abundant wind and solar, but sparse in infrastructure and limited natural gas pipelines. Meeting this demand will require not just more generation, but substantially expanded transmission infrastructure, which takes years and significant capital investment to plan, get permitted, and build.
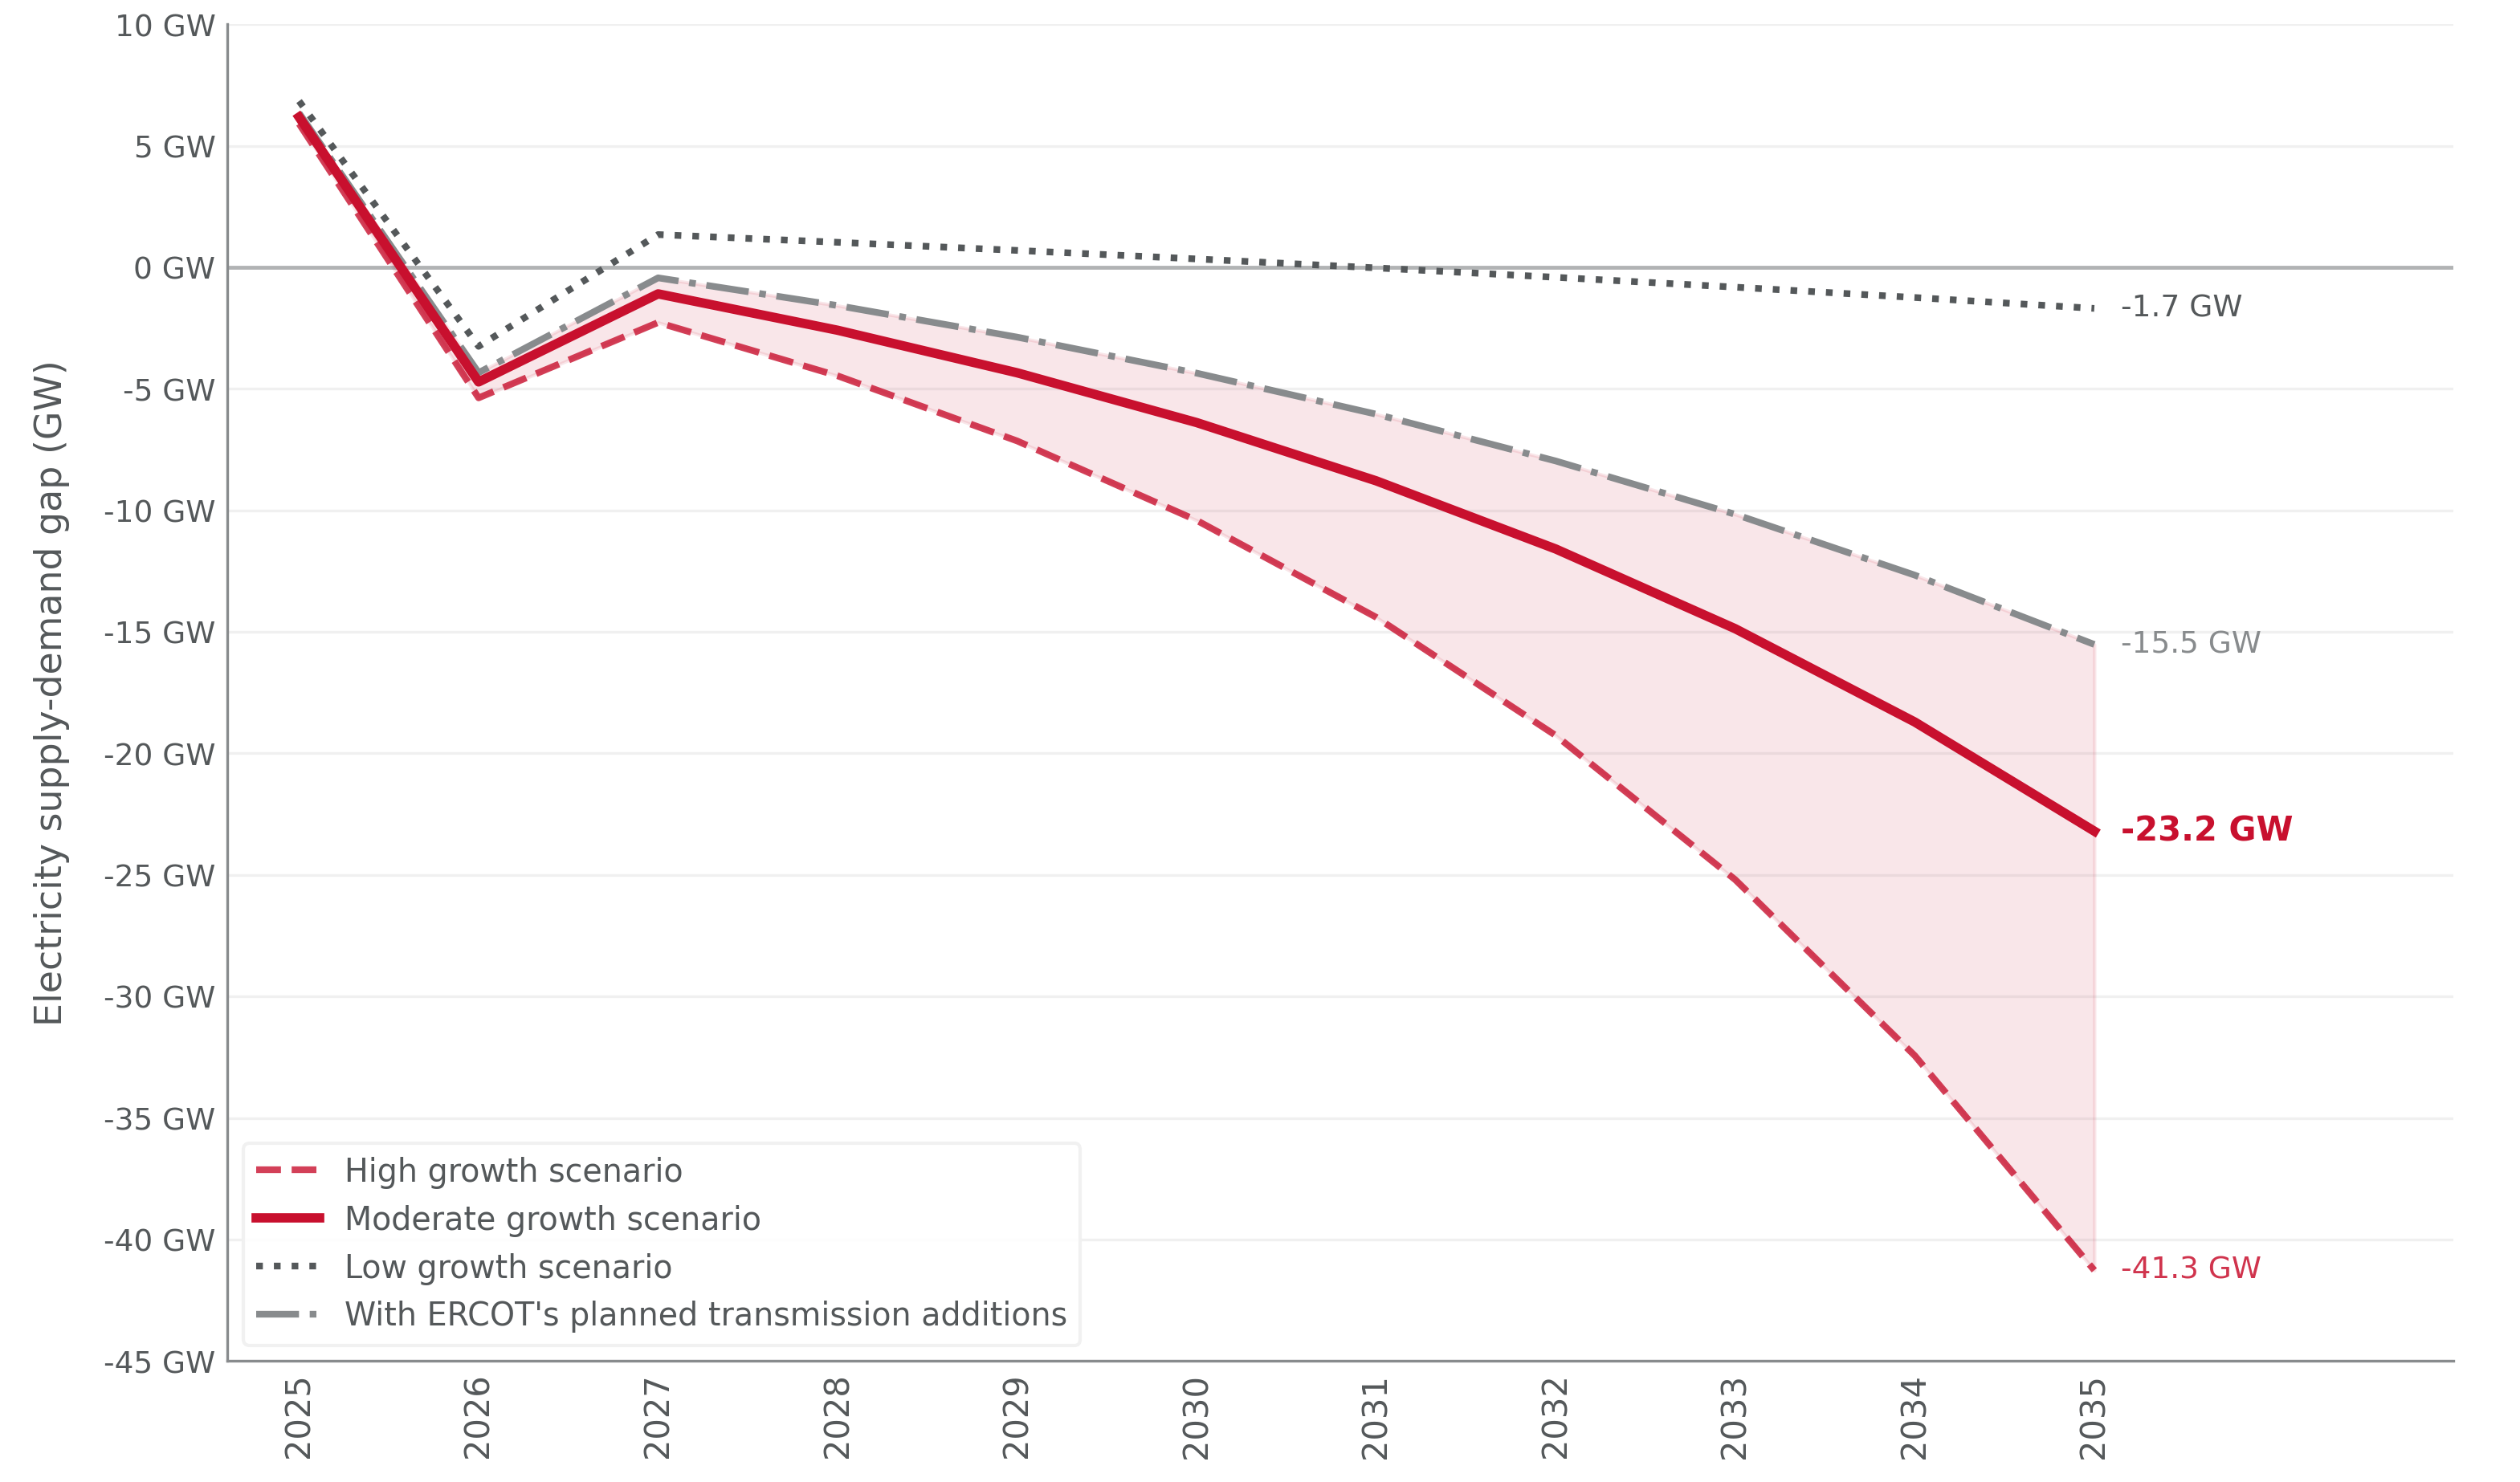
Data Source: Krishnamoorti and Datta (2025), "The Future of the Electric Grid in Texas," University of Houston.
Notes: Values represent the projected difference between planned electricity generation capacity additions and expected growth in electricity demand driven primarily by large-load data center interconnection requests, in megawatts (MW). Negative values indicate a deficit, where projected demand exceeds planned supply.
Aging Infrastructure and Extreme Weather
Texas's demand challenge does not exist in isolation.
Our electricity infrastructure was largely built for a different climate and a different era of demand and is now being asked to perform under conditions it was not designed to handle. When aging infrastructure meets extreme weather, the reliability and resilience challenges are multiplicative.
As our infrastructure assets age, they become more susceptible to weather-related damage, more expensive to maintain, and more likely to fail during weather stress events.
The policy response to date has been largely reactive. After each major extreme weather event in the state, legislation has produced new weatherization mandates and infrastructure requirements. These are necessary and a step in the right direction, but so far, most efforts are predominantly directed at generation facilities and transmission and distribution infrastructure, leaving many vulnerabilities in the production and transportation of feedstocks and geographic mismatches in supply and demand unaddressed.
Moreover, because infrastructure investment is recovered through ratepayer charges, the cost of each successive round of storm hardening compounds the affordability issues.
Our approach: Solving Energy Affordability as a Systems Problem
Our team has been working to understand energy affordability as a systems problem, connecting grid infrastructure and market design to household well-being, policy access, and everyday impacts and choices.
Our work spans three interconnected areas:
- The structural drivers of residential electricity prices, including the role of T&D costs, regulatory charges, and storm-hardening investments
- The institutional barriers to energy policies and programs that determine who receives help
- The future of the Texas and United States grid, including demand forecasting, capacity adequacy under different scenarios, and the mismatch between infrastructure investment and the needs of communities.